

Creating Powerful Post-Incident Analyses
Post-Incident Analyses (PIAs), After Action Reports, Incident Debriefings, Tailboard Talks…all are examples of what every fire department does after both major and minor incidents. In fact, if your department adheres to NFPA 1500, you are probably aware of the section that addresses the topic of requiring post-incident analyses when a firefighter is seriously injured or killed in the line of duty (NFPA 1500, 8.11.1). NFPA 1250-Recommended Practice in Emergency Service Organization Risk Management is another standard that cites the importance of PIAs.
With that said, it should never take a firefighter dying, someone getting badly injured, or breaking a really expensive piece of equipment to conduct a comprehensive PIA. If you’re taking the time to conduct a PIA, why not take it to the next level by producing a high-quality document that can be shared with a wider audience: the other shifts in your department, other departments in your region, or even the greater fire service nationwide.
Various technologies have already been created to help your PIAs pack weight. Our Google Maps integration will help you produce visually interesting documents guaranteed to jump-start discussions to improve organizational performance and safety.
Here’s a link to an executive summary of a PIA I completed a few years ago on a residential structure fire. Since that PIA was published, I’ve learned a few new tricks in ER and Google Earth that can make a good PIA even better.
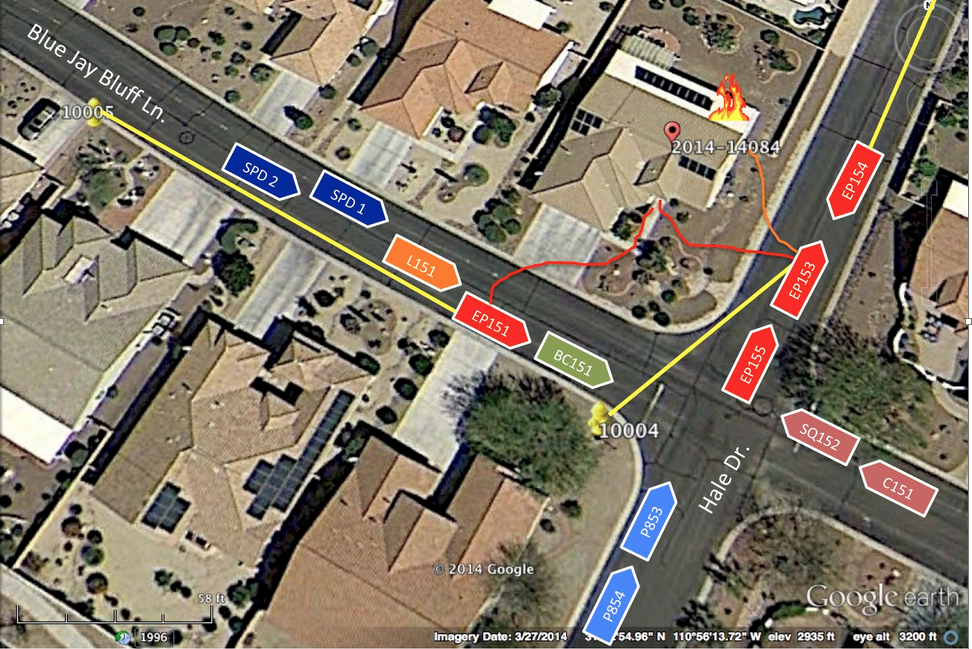
Did you know you can export your Occupancy, Hydrants, and Incidents geographical data right into Google Earth as a .kml (Keyhole Markup Language) file? This is an excellent way to capture an overhead view of the incident that will also display the exact location and ID of hydrants and exposures along with the incident number. One caveat: Be sure your data is accurate (especially the lat/long) before exporting it to Google Earth. As with any software platform, it’s always “Good stuff in, good stuff outâ€.
Once in Google Earth, you can save the image and import to another program so you can add apparatus, hose lays, and other details about the incident. It doesn’t take a special editing program to work with the image. Believe it or not, I used Microsoft PowerPoint to add icons and symbols to this imported image.
Of course, you can always take a screen grab of the image directly from Emergency Reporting as well. You just won’t have all of the tools found in Google Earth.
So, with just a few software tools that are already on your computer, you too can make an impact with powerful Post-Incident Analyses. Look for a future Virtual Thursday on getting the most out of the Google Map integration that will go through this process, step-by-step.
I’d love to see examples of PIAs you’ve created for your department. Please send them my way at [email protected].
Thanks for reading and stay safe.
